Sunday, May 30, 2010

Flow Map

Flow Map

The flow map is used for sequencing and ordering information. Students can use it to identify the relationships between stages and substages of an event (or order or numbers, operations, steps, etc.) They can be used to explain the order of events. The following site has examples of flow maps used in different subjects.


The flow map is created with large rectangles. The substages are in smaller rectangles below the
larger ones. The flow maps vary and not all flow maps have substages.

This map can be used to plot a story, show historical events in sequences, steps in problem solving math, identify stages of a life cycle and much more. This map can be applied to all subject areas.

In our classroom we have used the flow map throughout the year and most recently we used it to sequence an ELD story "Come Along Daisy". Our flow map had the parts of a story; characters, setting, problem, solved problem. We also used the flow map in science to sequence planting lima beans.



Saturday, May 22, 2010

The Tree Map


The Tree Map

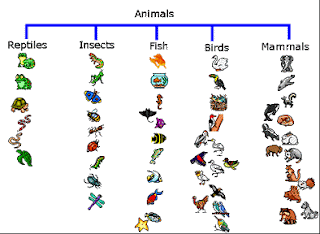
The three map is used for classifying and grouping. This map is used to sort things or ideas, categories or groups. New categories can also be created. There are many sites on the web that can give guidance as to the many uses of how to use the tree map.


These are some examples of how some grade levels used the tree map for different subjects.


Creating a Tree Map
It is easy to create a tree map. 1. The top horizontal line has the topic; 2.The second horizontal line has as many branches as needed for the subgroups. A subgroup is a subordinate group that exists within the main group. 3. Subgroups can be created within the subgroups.

In our classroom we have used the tree map from the beginning of the school year for several subjects. In Language Arts we classified syllables ( ma: mama, mano, mapa etc.); parts of speech (naming words for places, things and people). In math we used the map to sort sums of 5, 6, 7 etc.. We also used it to sort shapes, coins; etc.

We continue to use our tree map and as the year progresses we expand on its use.


Thursday, May 13, 2010

The Circle Map


Circle Map

The thinking maps have been a very effective tool in our school and our teachers and students are becoming better learners of the thought process used in writing. Thinking Maps are based on scientific research. A Language for learning (p. vi), the Thinking Maps manual, states that "Current brain research shows that the brain is a linguistic and nonlinguistic form." Thinking maps are a visual language that works in every grade and for every subject.

Our students are getting very familiar with these maps and by the time they reach upper grade they are able to combine the maps and use them for all their subjects. I teach first grade and can also see how familiar they are with the maps.

The circle map is one of the first maps students use. The Circle Map is simple to use for brainstorming ideas and for showing prior knowledge about a topic. This map adapts to the grade level. In the center of the circle map kindergarten students can draw pictures, apply realia, use photographs or pictures from magazines. As children learn to write, they can use words, numbers, or any other signs or symbols to represent the object, person, or idea being defined. In the outside circle, they can write, draw or use graphics for any information that puts the main object in context.

.

Saturday, May 8, 2010

What are thinking maps?


In our school district we have been using Thinking Maps for the past 5 years. These Thinking Maps are used from K-12 to help our students organize their thought process for writing.

The Thinking Maps consists of eight maps to aid in the thought process. The Circle Map is used for defining in context; the Bubble Map, helps in describing with adjectives; the Flow Map, sequencing and ordering; the Brace Map, identifies part/whole relationships; the Tree Map, classifies/grouping; the Double Bubble Map, is for comparing and contrasting; the Multi-Flow Map, analyzing causes and effects; and the Bridge Map, seeing analogies. These maps are used for all subject areas in grades K-12.


.